Return to calibration programs
Key features
As noted above this version is very similar to initial V.E.Yudin’s one in functionality and interface. The measurements are grouped into projects, which consist of scans. Scan is the set of poins for single measurements. The user can open projects, delete them or create new ones. Similar operations are available for scans and points.
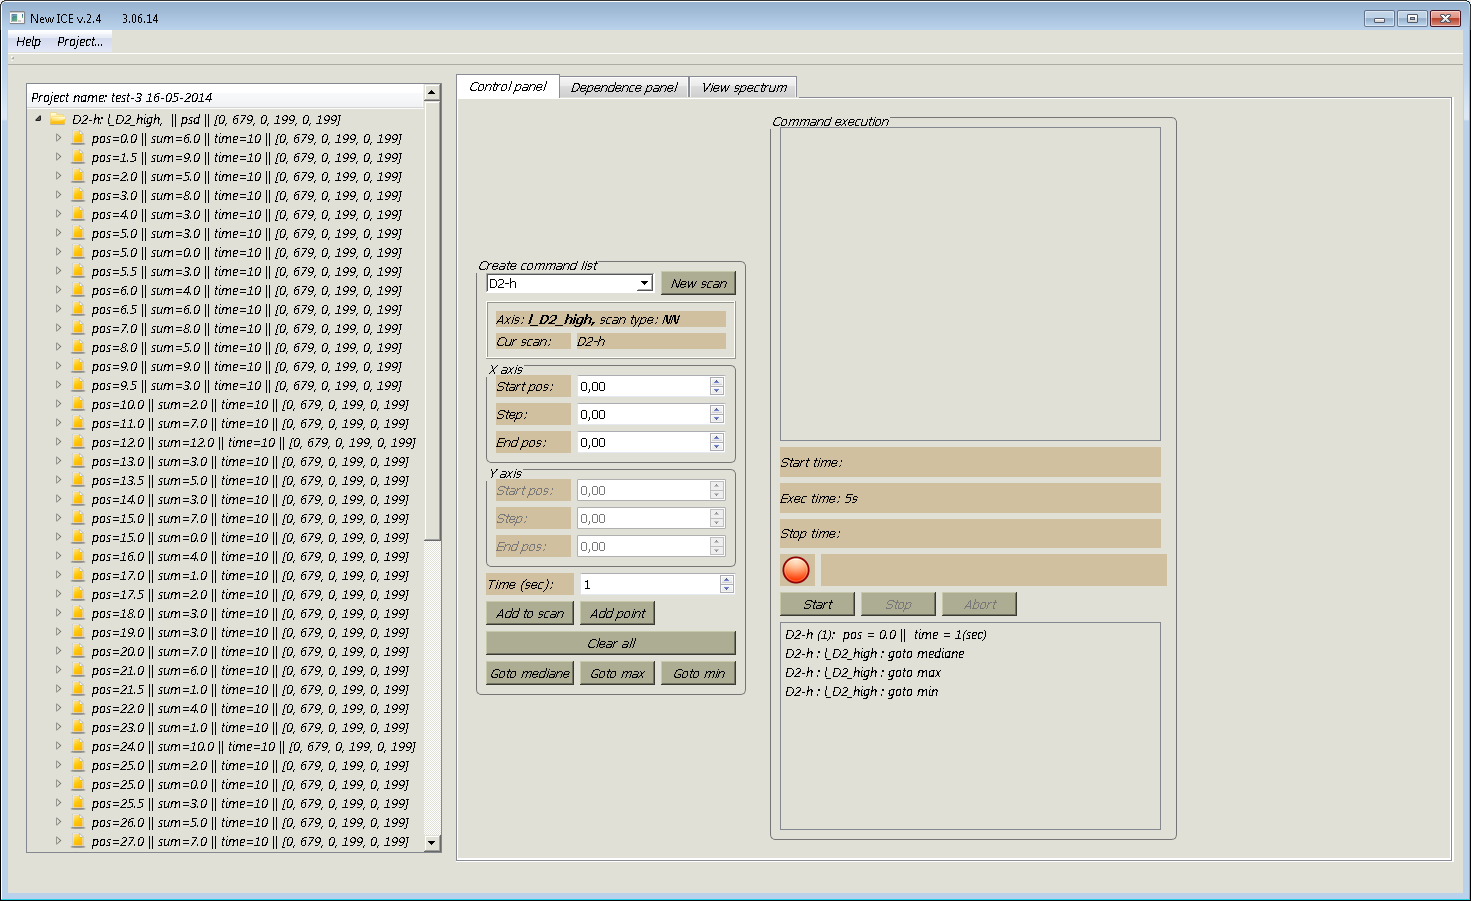
Figure 1. Navigation window and control panel
The navigation window is on the left at pte picture on the Figure 1. It provides information about the current project:
- The name of the project
- Scans and corresponding points in a tree.
Each point refers to one or two spectra.
The control panel (in the middle) allows the user to create a new scan, or add new poins to the one of the existing scans. The righ panel is devoted to execute scans. The newly created or added points are displayed in the bottom list of the panel, waiting for measurement. The user is able to control of scan execution win buttons “Start”, “Stop” and “Abort”. The currently measured point is displayed in the middle.The upper list contains points beig measured.
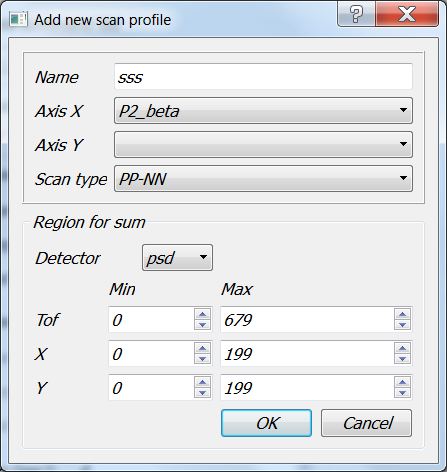
Parameters of the projects, and the contents of the list for execution are saved and restored automatically when the program is called. To define a new scan (Fig. 2), the user enters its name and selects the scan parameters:
- Axis(axes) name(s)
- Type of scan
- Detector, and the range for summing
Fig.2. Setting a new scan
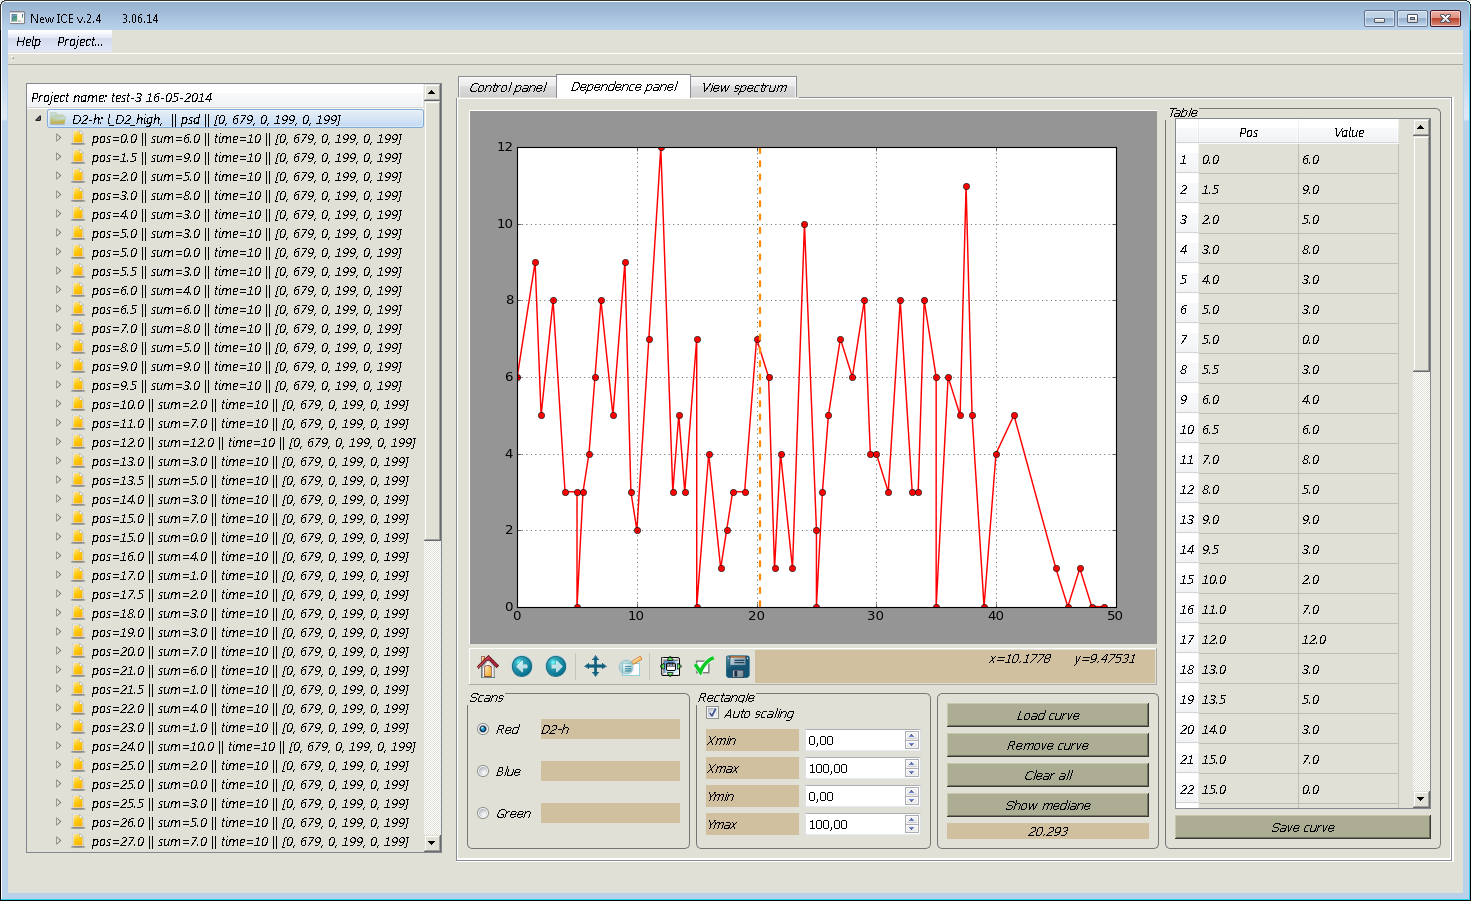
On the “Dependence panel” (Figure 3) data for one-dimensional scans are displayed as a curves and tabules. For the current scan the red color is used. The user can also compares current scan with one or two other scans ot the project or download data from ASCII file.
Figure 3. Dependency Visualization
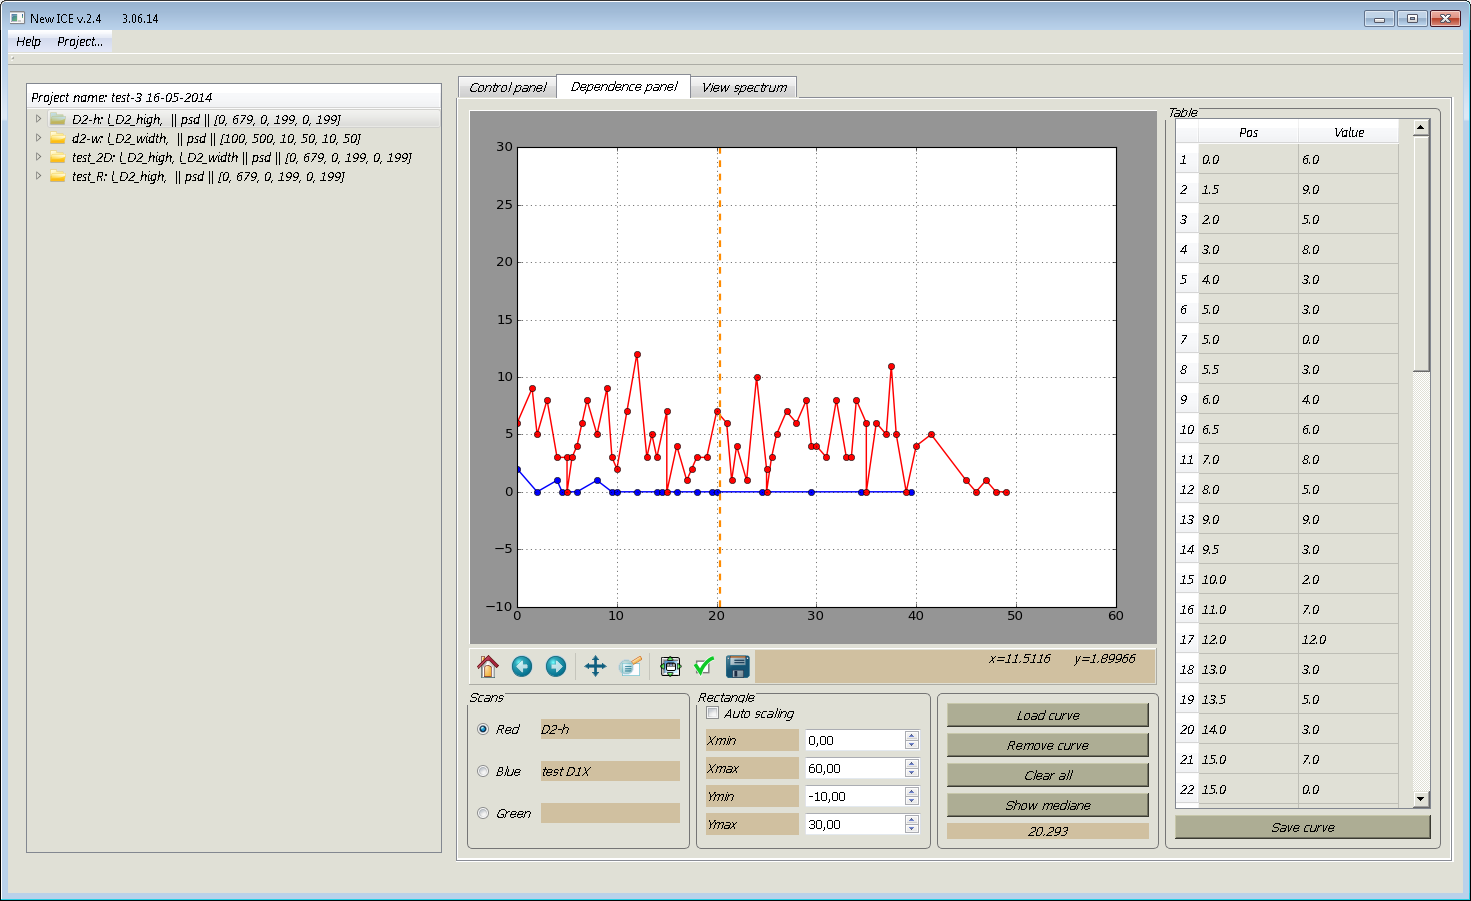
The checkbox “Auto scaling” sets the automatic scaling mode for charts. Without this scale is defined in accordance with the values of Xmin, Xmax, Ymin, Ymax (Figure 4).
Figure 4. Visualization of dependencies with the image of graphs in a fixed range.
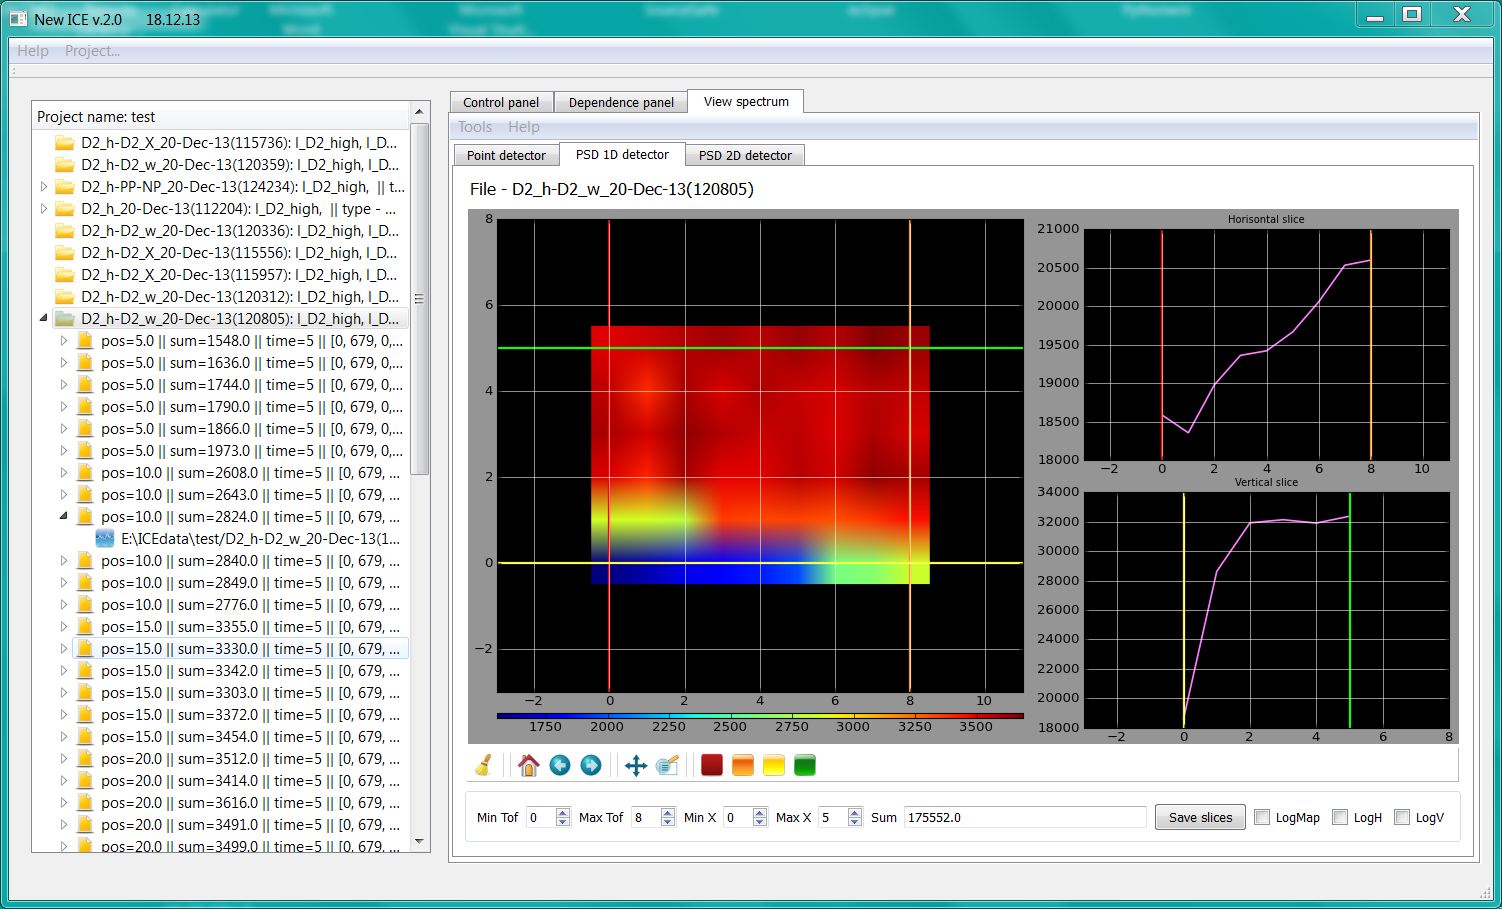
The button “Show mediane” allows the user to calculate the position of the optimal position for current scan. The mediane is displayed as a vertical dashed line. Visualization of dependencies for two-dimensional scans is displayd as a color map, similar to the data from the one-dimensional PSD. All operaions for this type of data are also available (Figure 5).
Fig. 5. An example for display if two-dimensional scan.
Return to calibration programs
— kirilov 2015/12/03 11:06

